Hands-on Introduction to R 2020
- Why do we use R?
- R basics
- Visualization with R
- Tidying and transforming data with R
- Statistical analysis with R
2020-05-27
R basics: Index
🖥 Setup R environment
👽 Conversation with R
📁 Create a “project” and “script”
➕ Basic operations and types
📦 Package
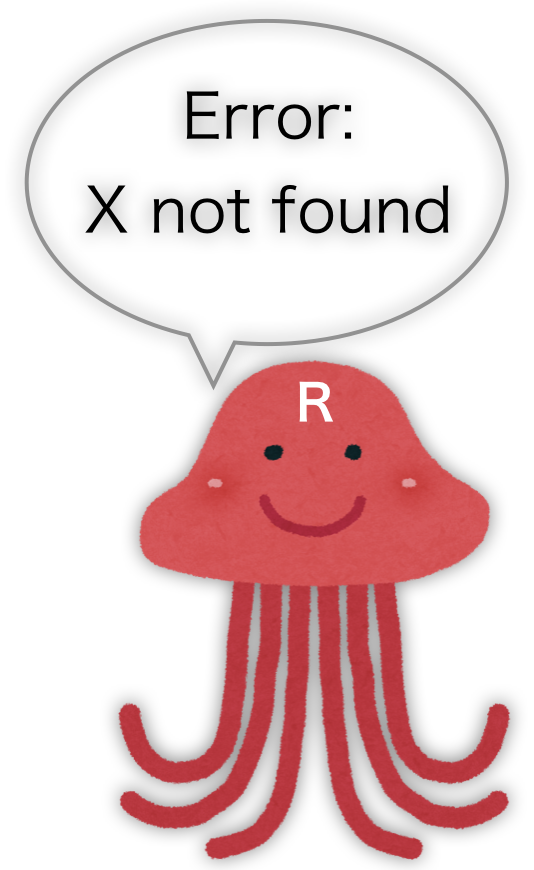
❓ Errors and questions
環境依存の不具合 🤮
-
"
Windows + 🇯🇵日本語ユーザー名" だと不具合が生じがち。
英語名ユーザーを作りなおして引っ越したほうがいい。 -
OS全体の言語設定も英語にするのがオススメ。
-
できれば
Macを使うのが無難。
Linuxが使えるならなお良い。
Keyboard shortcuts
| Action | ||
|---|---|---|
| Switch apps | commandtab | alttab |
| Quit apps | commandq | altF4 |
| Spotlight | commandspace | |
| Cut, Copy, Paste | commandx, -c, -v | ctrlx, -c, -v |
| Select all | commanda | ctrla |
| Undo | commandz | ctrlz |
| Find | commandf | ctrlf |
| Save | commands | ctrls |
Setup Mac environment
-
Set OS language to English (System Preferences → Language & Region)
-
Install Command Line Tools via Terminal.app:
xcode-select --installFull Xcode is not necessary, but you can have it if you like.
-
Install Homebrew (software manager):
/bin/bash -c "$(curl -fsSL https://raw.githubusercontent.com/Homebrew/install/master/install.sh)" -
Try installing some softwares:
brew install wget
wget https://cran.r-project.org/Rlogo.svg
ls
Setup R environment
brew cask install r rstudio
- R
- Core software to interpret and execute commands.
- Standard packages and functions are included.
- RStudio Desktop
- Integrated environment to help users interact with R.
- Not necessary, but many people like it.
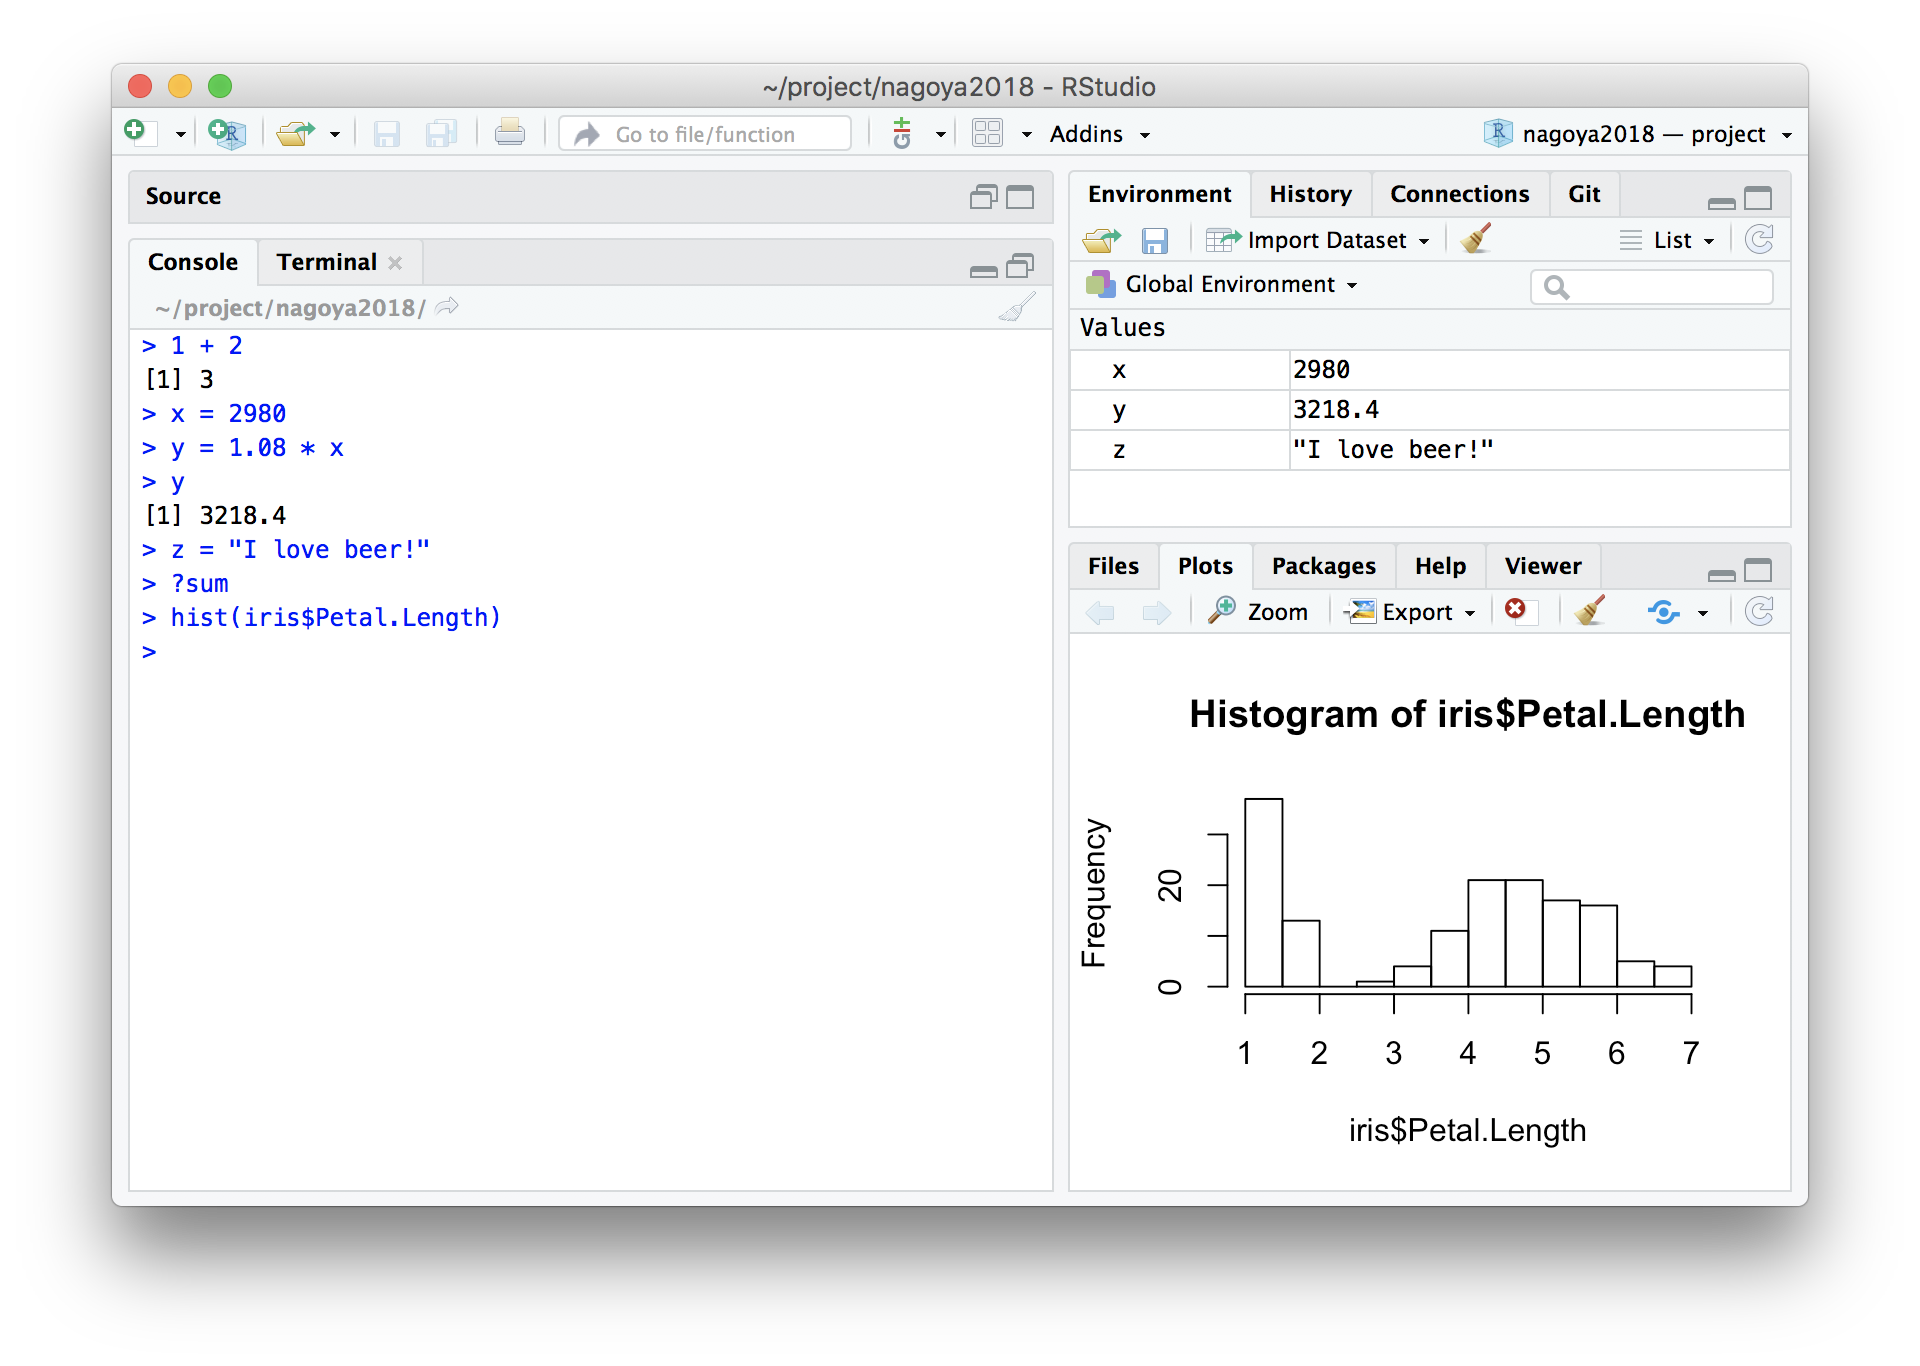
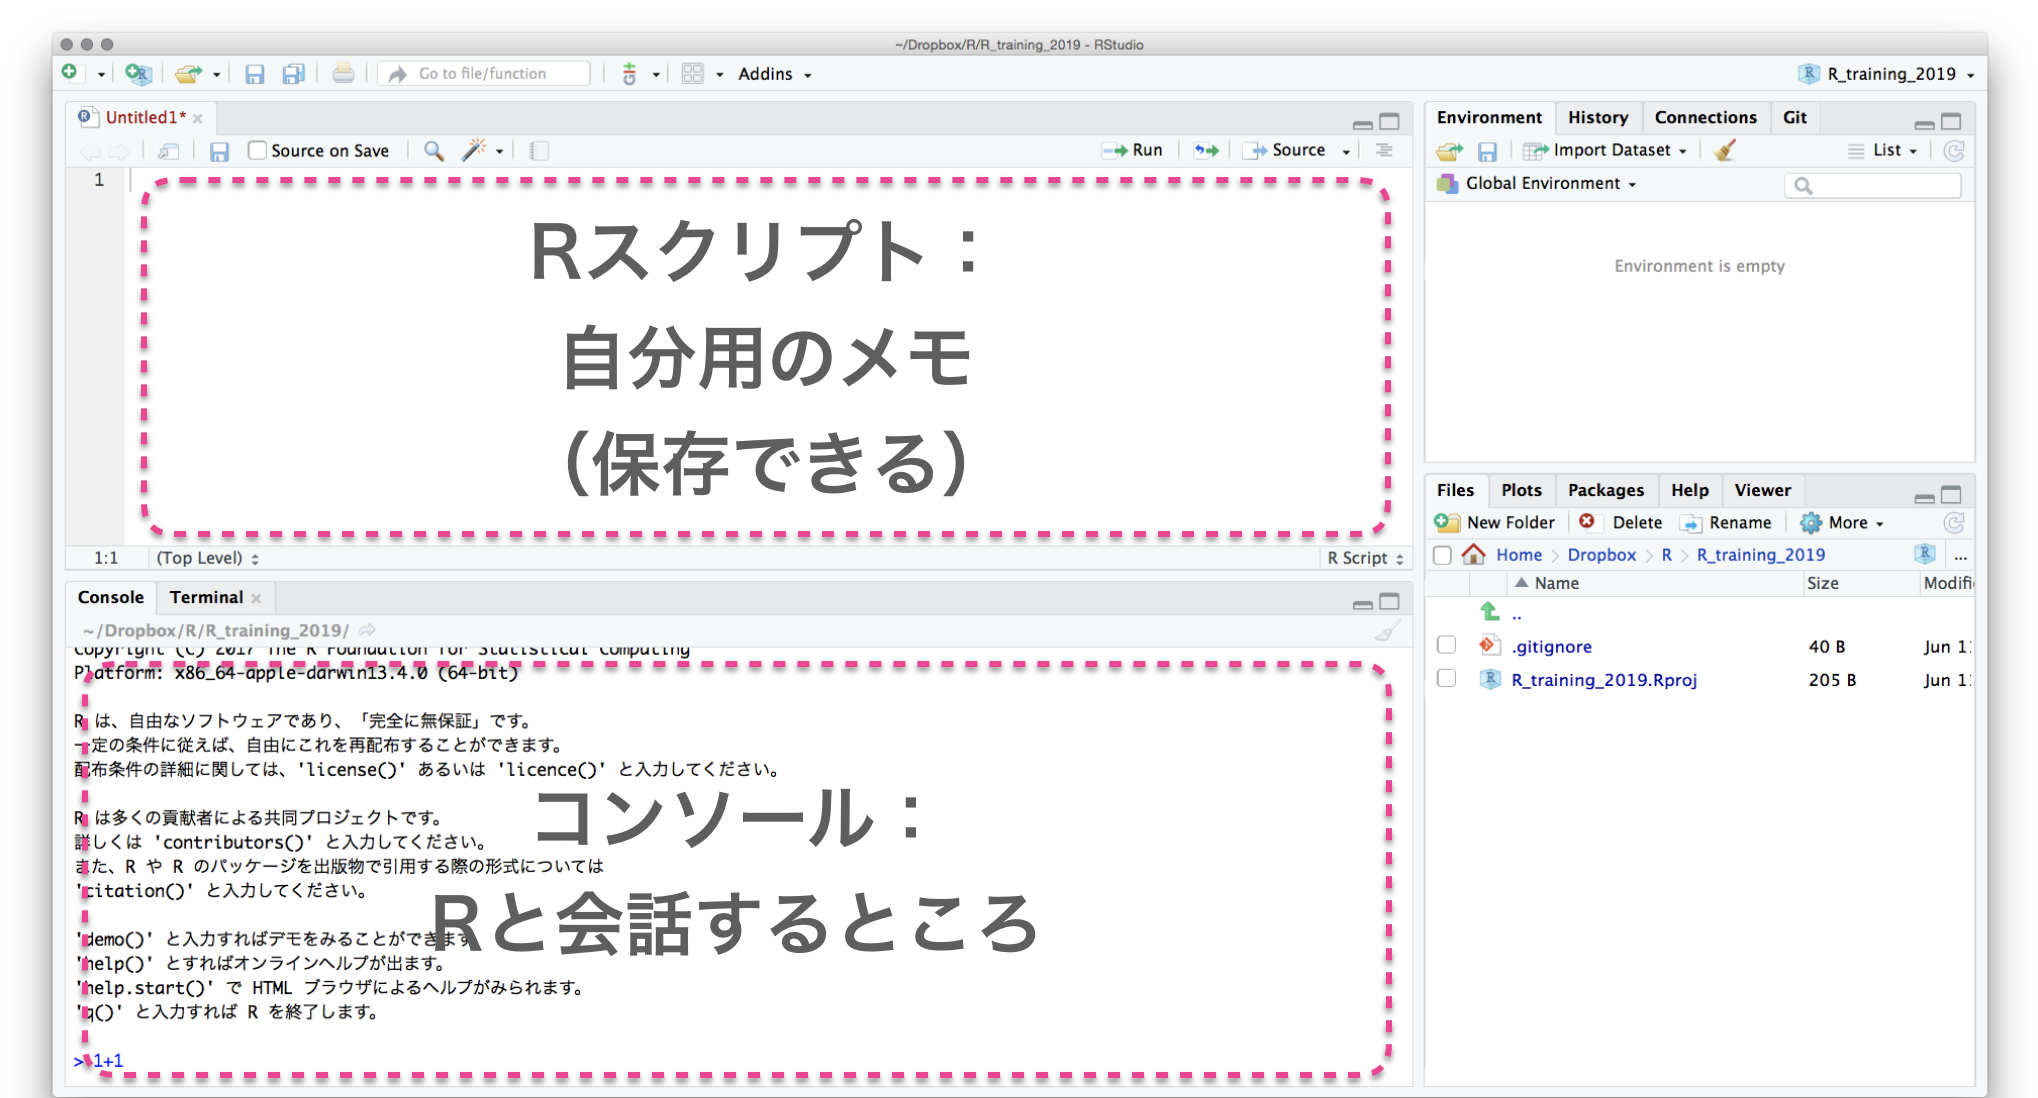
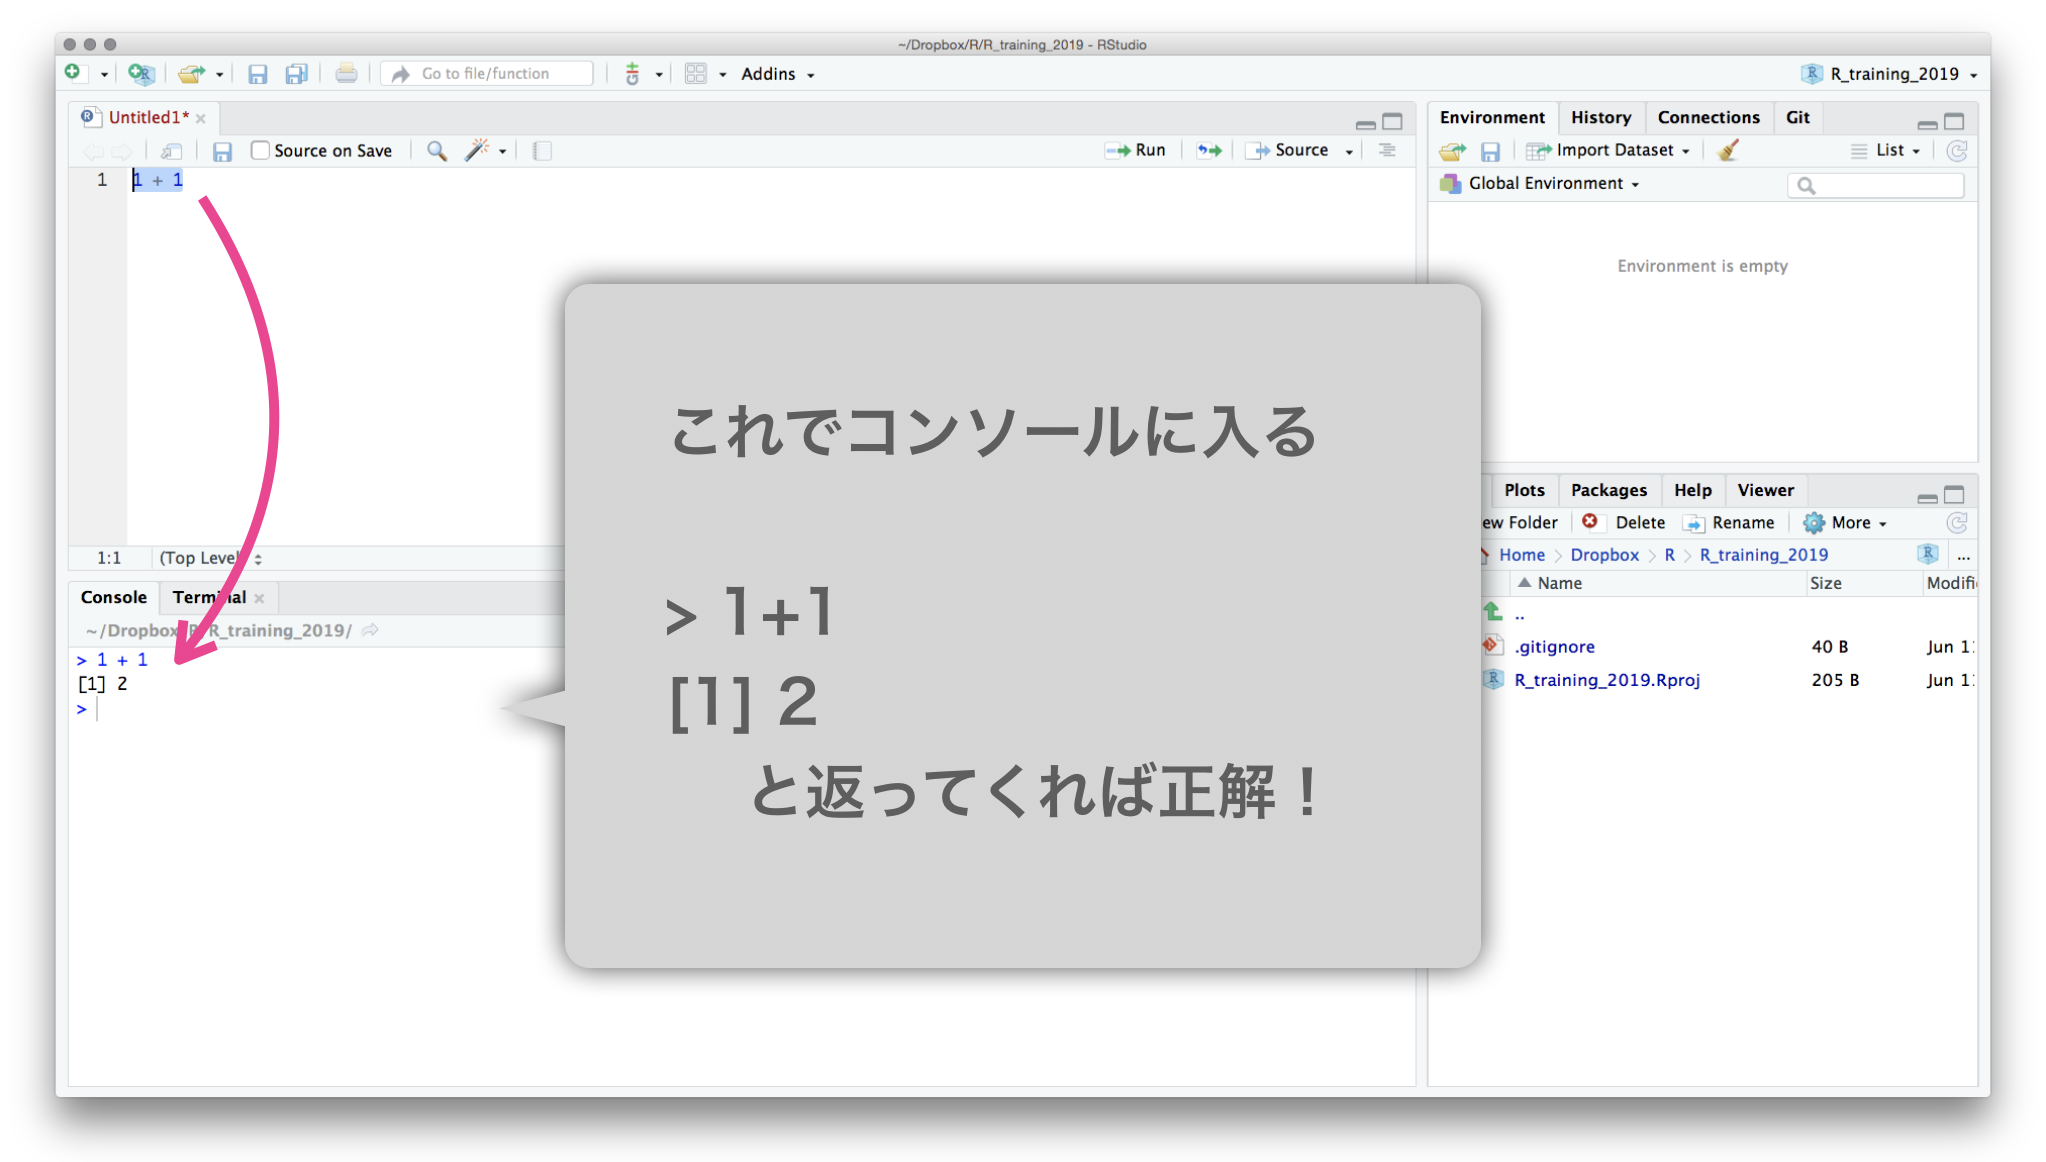
Launch RStudio and play with Console
Workspace (Environment) = a set of temporary objects
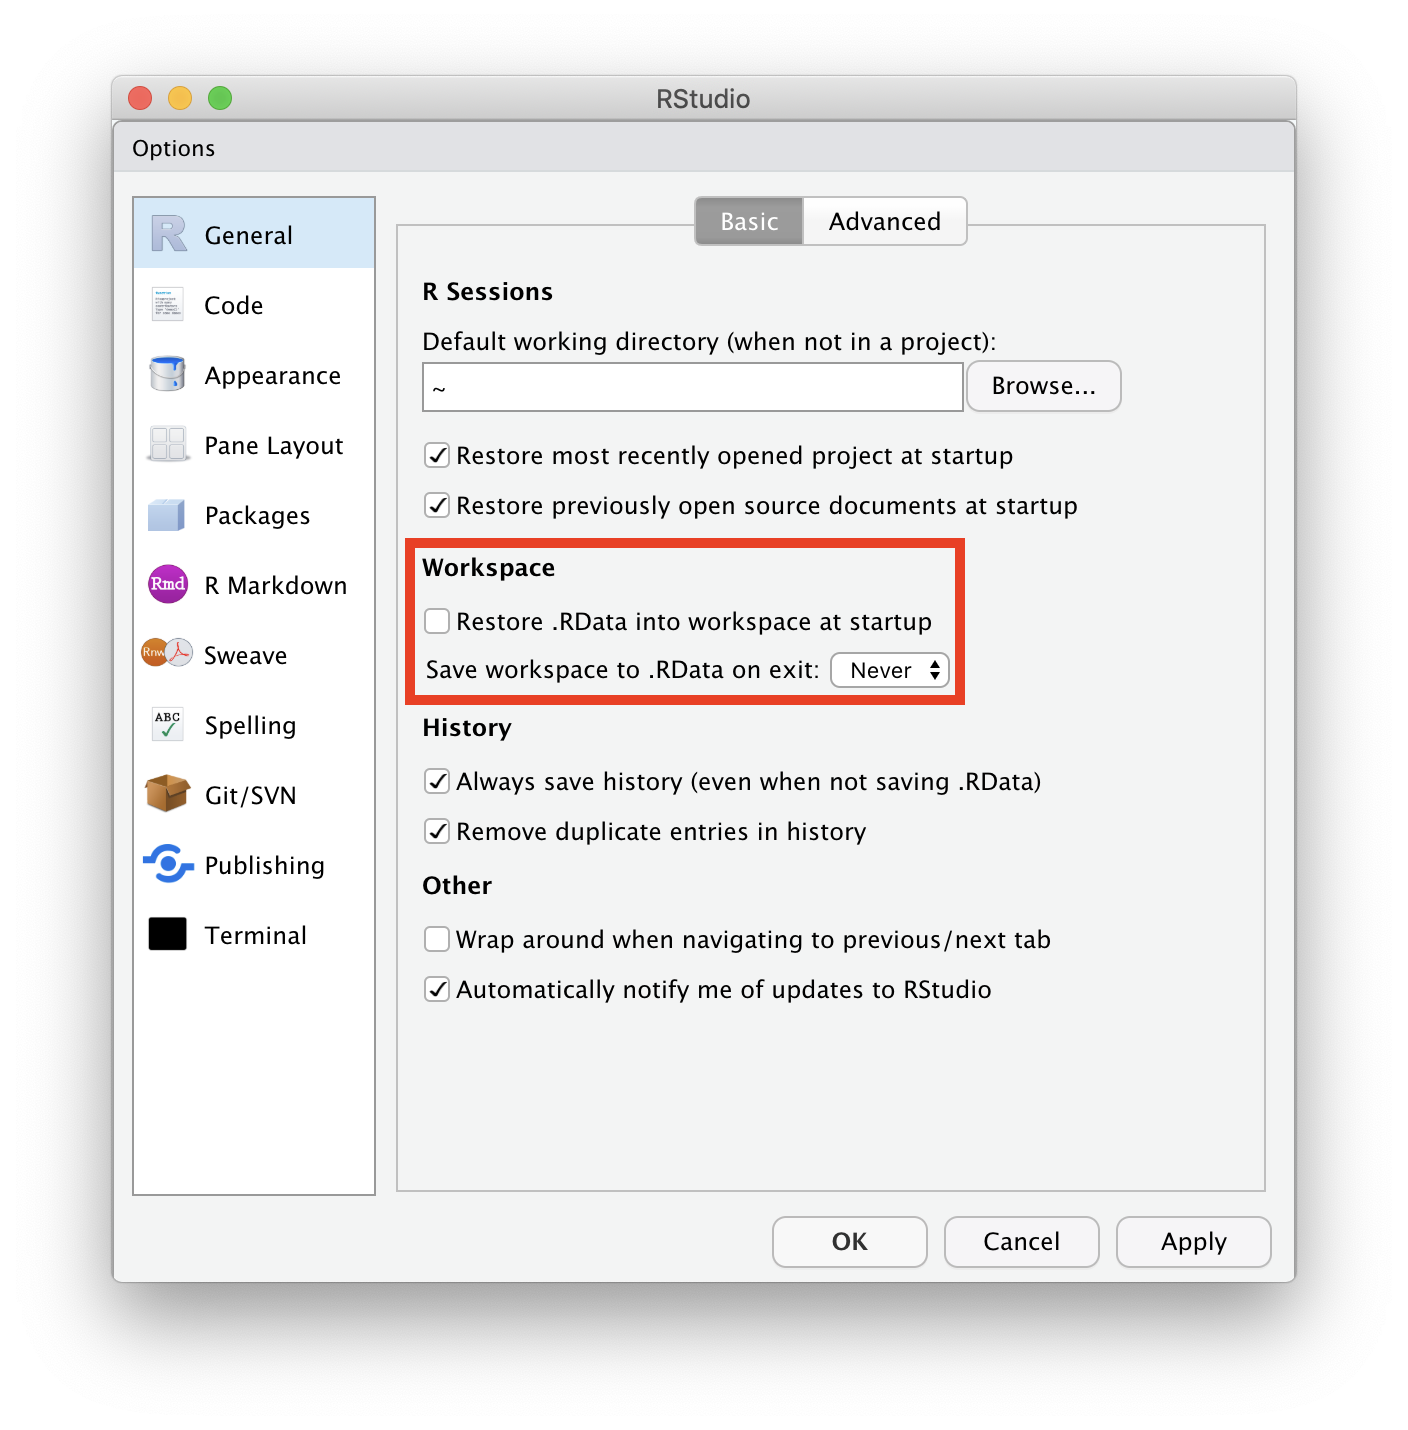
Configure RStudio NOT to save/load workspace
RStudio → Preferences command,
Tools → Global options
Uncheck “Restore …”, Choose Never for “Save workspace …”.
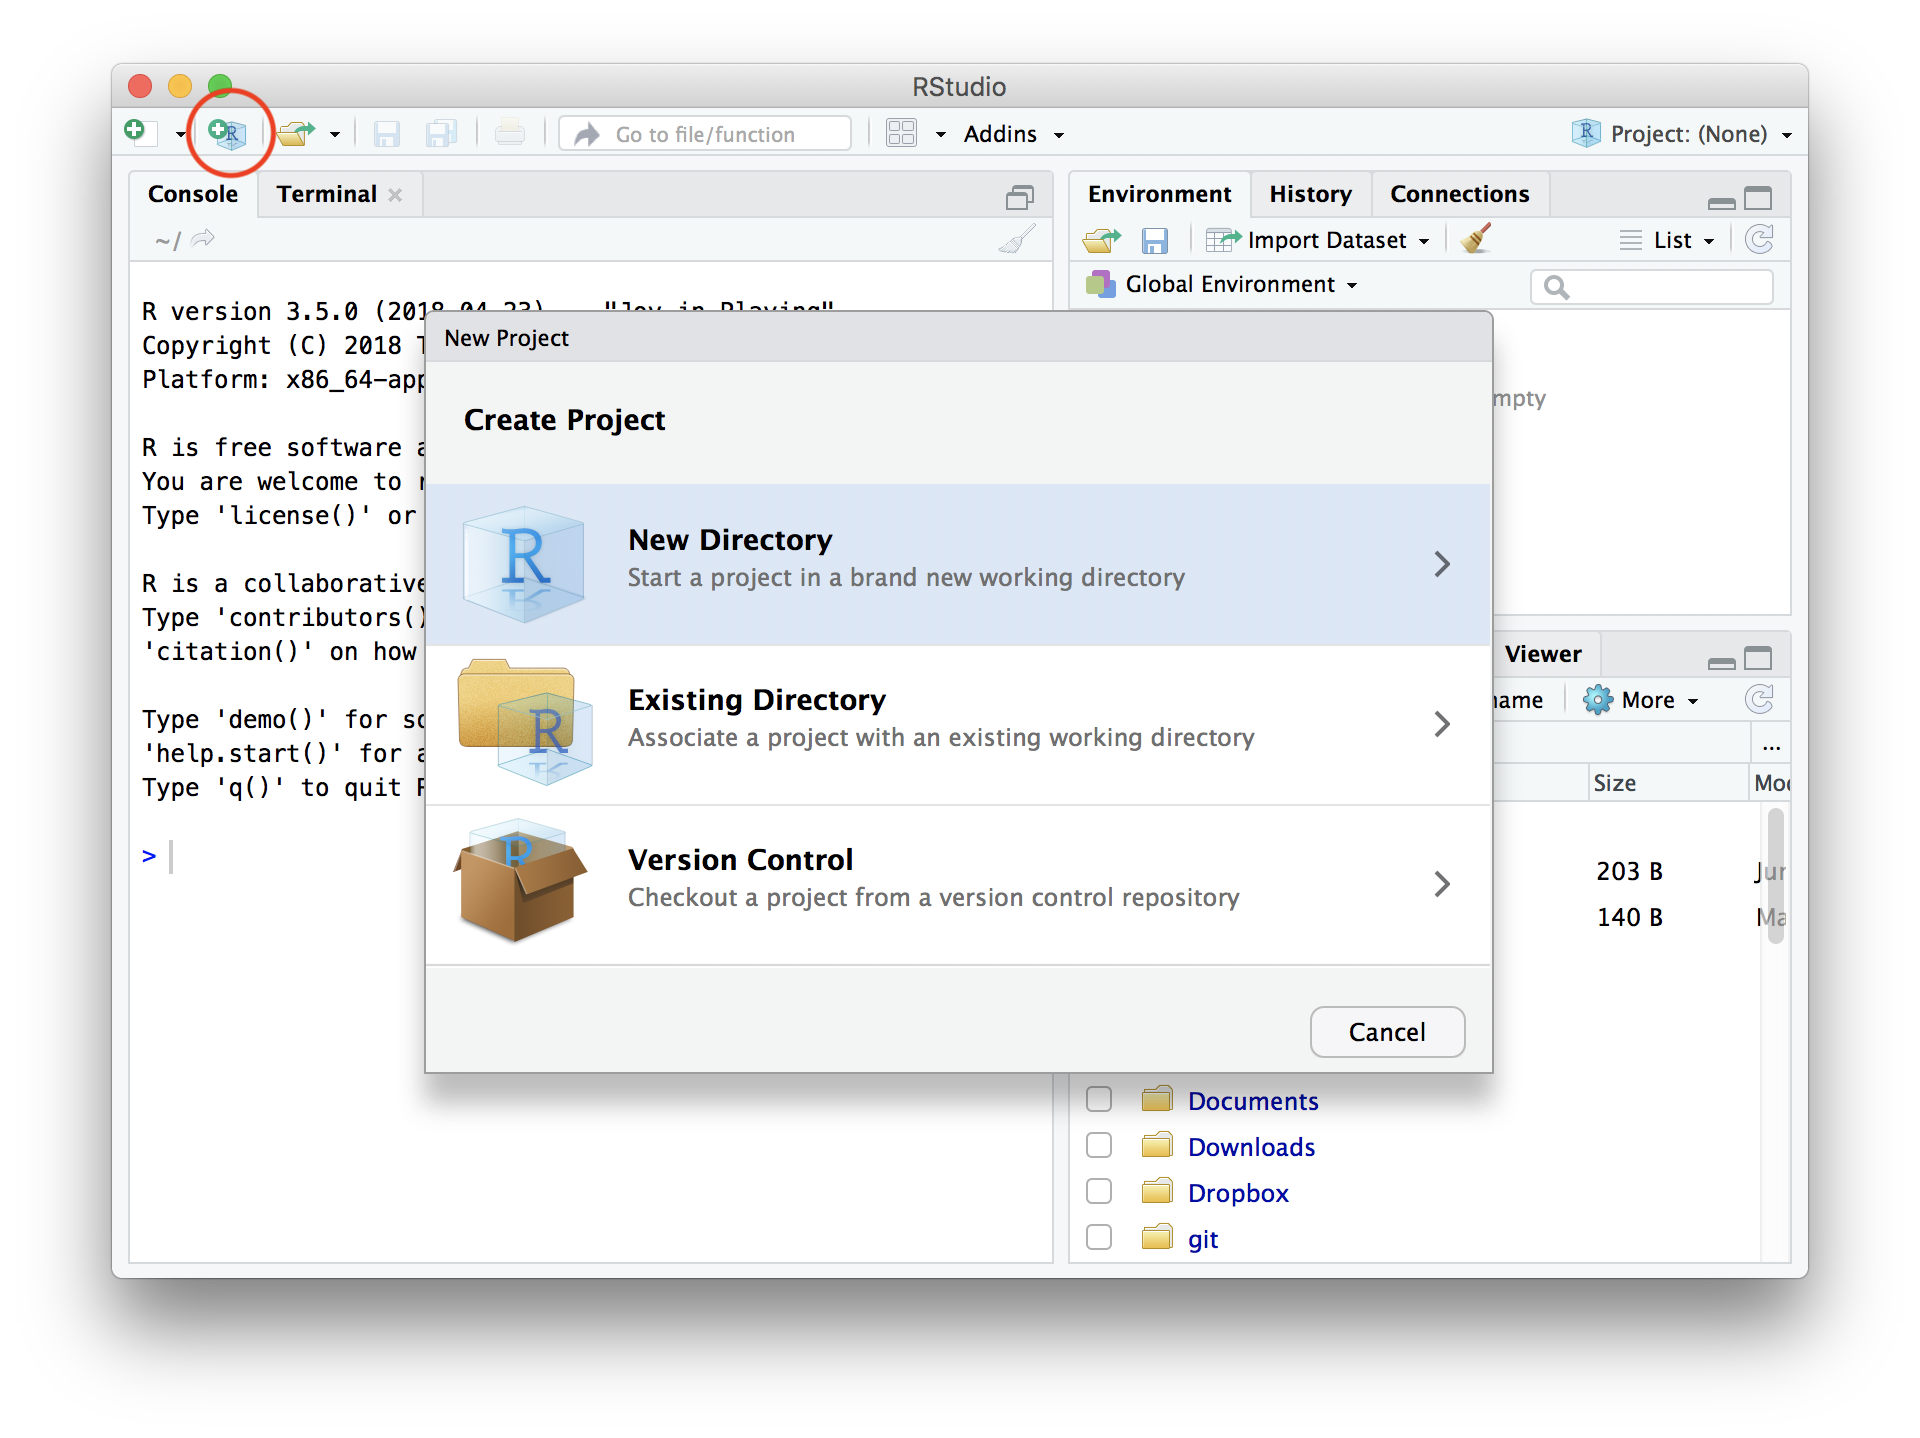
Create “Project”
File → New Project… → New Directory → New Project →
→ Directory name: r-training-2020
→ as subdirectory of: ~/project
Write R script, and send it to Console
File → New File → R script
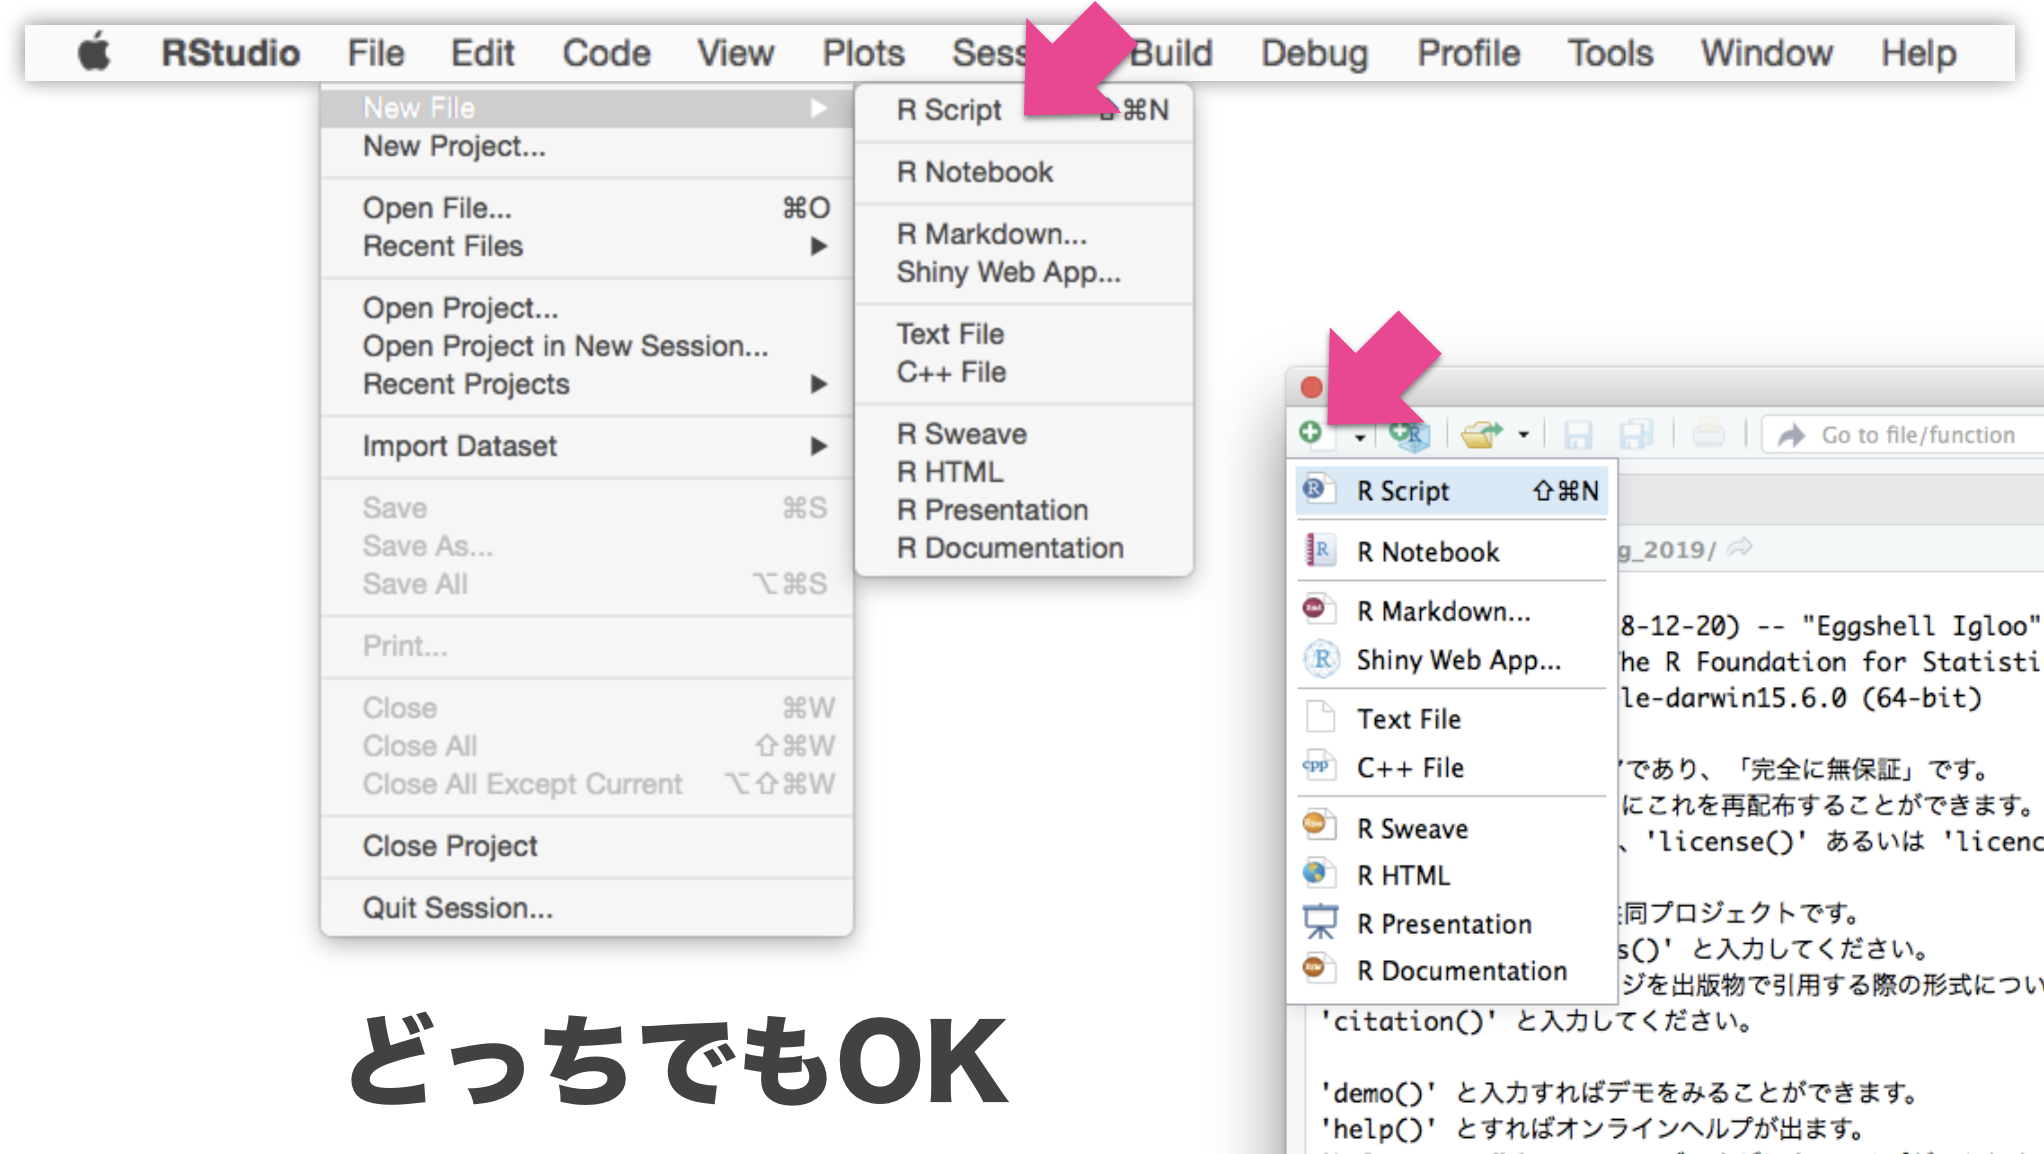
Write R script, and send it to Console
File → New File → R script
Write R script, and send it to Console
Select text with shift←↓↑→
Execute them with ctrlreturn
Save R script in the project: commands
Separate data, scripts, and results, e.g.,
r-training-2020/           # プロジェクトの最上階
├── data/                  # 元データを置くところ
│   ├── iris.tsv
│   └── diamonds.xlsx
├── r-training-2020.Rproj  # これダブルクリックでRStudioを起動
├── hello.R
├── output/                # 結果の出力先
│   ├── iris-petal.png
│   └── iris-summary.tsv
├── transform.R            # データ整理・変形のスクリプト
└── visualize.R            # 作図のスクリプト
プロジェクト最上階を作業ディレクトリとし、
ファイル読み書きの基準にする。(後で詳しく)
ほんの一例です。好きな構造に決めてください。
Rと接する上での心構え
- エラー文を恐れない
- 熟練プログラマでも頻繁にエラーを起こす。
- エラーはRからのメッセージ。意図を読み取って修正しよう。
- 困ったらウェブ検索
- あなたの問題は全世界のRユーザーが既に通った道。
- 日本語で、英語で、エラー文そのもので検索すれば解決策に当たる。
- (コードの)コピペ推奨
- 打ち間違いによるエラーを防げるし、早い。
- ネット上で見つけたコードもまずはコピペしてから自分用に改変。
- (ただし、ライセンスには注意…)
Create objects/variables (変数)
x = 42       # Create x
x            # What's in x?
[1] 42
y = "24601"  # Create y
y            # What's in y?
[1] "24601"
Rでは代入演算子として矢印 <- も使えるけど私は = 推奨。
この x と y を足そうとするとエラーになる。なぜ?
x + y # Error! Why?
Error in x + y: non-numeric argument to binary operator
Object types (型)
class(x)
[1] "numeric"
is.numeric(x)
[1] TRUE
is.character(x)
[1] FALSE
as.character(x)
[1] "42"
Try applying the same functions to y.
Object types (型)
vector: 基本型。一次元の配列。logical: 論理値 (TRUEorFALSE)numeric: 数値 (整数42Lor 実数3.1416)character: 文字列 ("a string")factor: 因子 (文字列っぽいけど微妙に違う)
array: 多次元配列。vector同様、全要素が同じ型。matrix: 行列 = 二次元の配列。
list: 異なる型でも詰め込める太っ腹ベクトル。data.frame: 同じ長さのベクトルを並べた長方形のテーブル。重要。
tibbleとかtbl_dfと呼ばれる亜種もあるけどほぼ同じ。
Function (関数)
変数を受け取って、何か仕事して、返す命令セット
x = seq(1, 3)  # 1と3を渡すとvectorが返ってくる
x
[1] 1 2 3
sum(x) # vectorを渡すと足し算が返ってくる
[1] 6
square = function(something) {  # 自分の関数を定義
  something ** 2
}
square(x)                       # 使ってみる
[1] 1 4 9
vector: 1-dimensional array
1個の値でもベクトル扱い。
同じ長さ(または長さ1)の相手との計算が得意。
x = c(1, 2, 9)  # 長さ3の数値ベクトル
x + x           # 同じ長さ同士の計算
[1] 2 4 18
y = 10          # 長さ1の数値ベクトル
x + y           # 長さ3 + 長さ1 = 長さ3 (それぞれ足し算)
[1] 11 12 19
sqrt(x) # square root
[1] 1.000000 1.414214 3.000000
# We don't have to write for-loop like this
z = c(0, 0, 0)
for (i in seq(1, 3)) {
  z[i] = sqrt(x[i])
}
matrix: 2-dimensional array (行列)
1本の vector を折り曲げて長方形にしたもの。
中身は全て同じ型。機械学習とか画像処理とかで使う。
v = seq(1, 8)              # c(1, 2, 3, 4, 5, 6, 7, 8)
x = matrix(v, nrow = 2)    # 2行に畳む。列ごとに詰める
x
     [,1] [,2] [,3] [,4]
[1,]    1    3    5    7
[2,]    2    4    6    8
y = matrix(v, nrow = 2, byrow = TRUE)  # 行ごとに詰める
y
     [,1] [,2] [,3] [,4]
[1,]    1    2    3    4
[2,]    5    6    7    8
Let’s try x + y, dim(x), nrow(x), ncol(x).
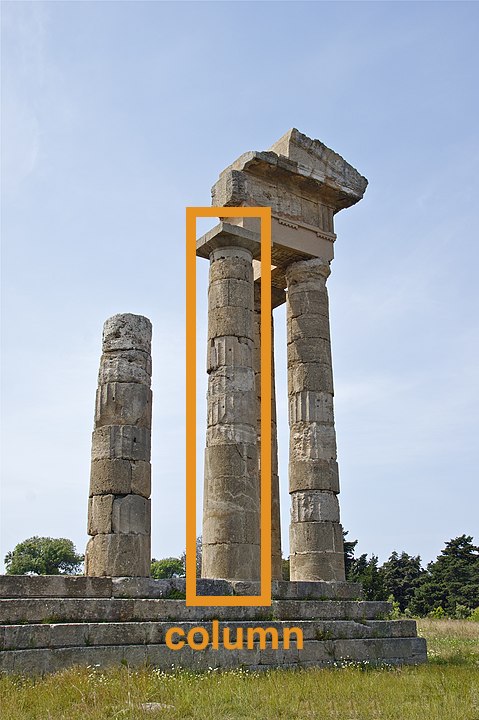
行 (row), 列 (column) の憶え方

data.frame: rectangle table (IMPORTANT!)
同じ長さの列 vector を複数束ねた長方形の表。
e.g., 長さ150の数値ベクトル4本と因子ベクトル1本:
print(iris)
    Sepal.Length Sepal.Width Petal.Length Petal.Width   Species
           <dbl>       <dbl>        <dbl>       <dbl>     <fct>
  1          5.1         3.5          1.4         0.2    setosa
  2          4.9         3.0          1.4         0.2    setosa
  3          4.7         3.2          1.3         0.2    setosa
  4          4.6         3.1          1.5         0.2    setosa
 --
147          6.3         2.5          5.0         1.9 virginica
148          6.5         3.0          5.2         2.0 virginica
149          6.2         3.4          5.4         2.3 virginica
150          5.9         3.0          5.1         1.8 virginica
iris はアヤメ属3種150個体に関する測定データ。
Rに最初から入ってて、例としてよく使われる。
data.frameを眺める
概要を掴む:
head(iris, 6)   # 先頭だけ見てみる
nrow(iris)      # 行数: Number of ROWs
ncol(iris)      # 列数: Number of COLumns
names(iris)     # 列名
summary(iris)   # 要約
View(iris)      # RStudioで閲覧
str(iris) # 構造が分かる形で表示
tibble [150 × 5] (S3: tbl_df/tbl/data.frame)
 $ Sepal.Length: num [1:150] 5.1 4.9 4.7 4.6 5 5.4 4.6 5 4.4 4.9 ...
 $ Sepal.Width : num [1:150] 3.5 3 3.2 3.1 3.6 3.9 3.4 3.4 2.9 3.1 ...
 $ Petal.Length: num [1:150] 1.4 1.4 1.3 1.5 1.4 1.7 1.4 1.5 1.4 1.5 ...
 $ Petal.Width : num [1:150] 0.2 0.2 0.2 0.2 0.2 0.4 0.3 0.2 0.2 0.1 ...
 $ Species     : Factor w/ 3 levels "setosa","versicolor",..: 1 1 1 1 1 1 1 1 1 1 ...
ほかのデータもいろいろ見てみよう, e.g., mtcars, quakes, data()
data.frameを眺める
部分的なdata.frameを取得する:
iris[2, ]                  # 2行目
iris[2:5, ]                # 2行目から5行目まで
iris[, 3:4]                # 3-4列目
iris[2:5, 3:4]             # 2-5行目, 3-4列目
vectorとして取得する:
iris[[3]]                  # 3列目
iris$Petal.Length          # Petal.Length列
iris[["Petal.Length"]]     # Petal.Length列
iris[["Petal.Length"]][2]  # Petal.Length列の2番目
結果がdata.frameになるかvectorになるか微妙:
iris[, 3]                  # 3列目
iris[, "Petal.Length"]     # Petal.Length列
iris[2, 3]                 # 2行目3列目
iris[2, "Petal.Length"]    # 2行目Petal.Length列
data.frameの新規作成
同じ長さの 列(column) vector を結合して作る:
x = c(1, 2, 3)
y = c("A", "B", "C")
mydata = data.frame(x, y)
print(mydata)
  x y
1 1 A
2 2 B
3 3 C
data.frameの読み書き
-
readxlパッケージを使えば
.xlsxファイルも読める、けど -
カンマ区切り(CSV)とかタブ区切り(TSV)のテキストが無難。
-
ファイル名は作業ディレクトリからの相対パスで指定。
install.packages("readr") # R標準の read.table() とかは難しいので library(readr) # パッケージのやつを使うよ write_tsv(iris, "data/iris.tsv") # 書き出し iris2 = read_tsv("data/iris.tsv") # 読み込み -
現在の作業ディレクトリとその中身を確認しておこう:
getwd()               # Get Working Directory
list.files(".")       # List files in "."
list.files("data")    # List files in "./data"
R組み込みデータや自作データを読み書きしてみよう
R package
便利な関数やデータセットなどをひとまとめにしたもの。
- Standard Packages
- Rの標準機能。何もしなくても使用可能
- Contributed Packages
- 有志により開発され、 CRAN にまとめて公開されている。
- 要インストール。使う前に読み込むおまじないが必要。
install.packages("readr")  # 一度やればOK
library(readr)             # 読み込みはRを起動するたびに必要
update.packages()          # たまには更新しよう
- 素のRも覚えきってないのにいきなりパッケージ?
- 大丈夫。誰も覚えきってない。
- パッケージを使わないR作業 = 火もナイフも使わない料理
tidyverse
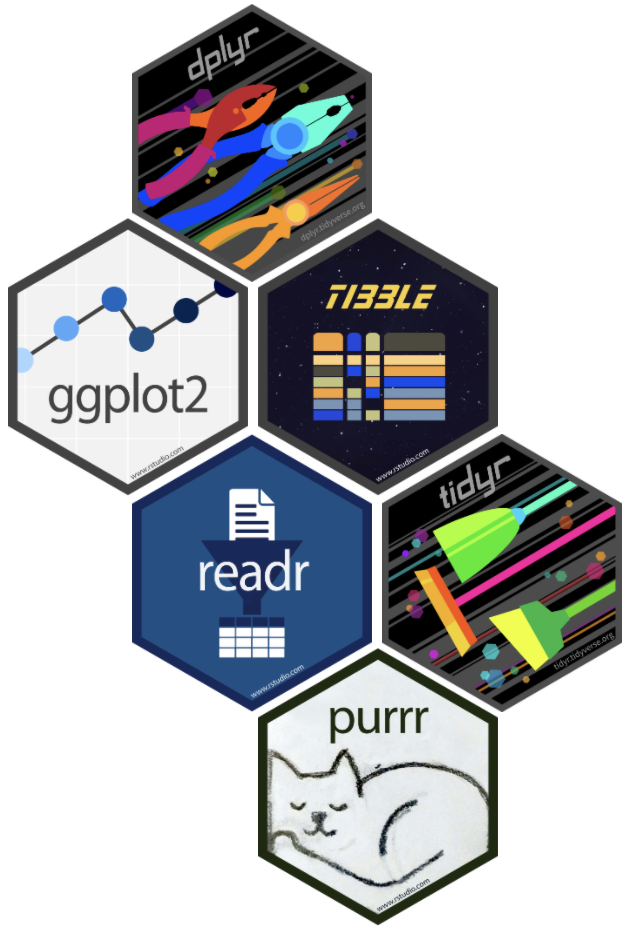
Rでデータを上手に扱うためのパッケージ群
install.packages("tidyverse")
library(tidyverse)
# 関連パッケージが一挙に読み込まれる
- 統一的な使い勝手
- 暗黙の処理をなるべくしない安全設計
- シンプルな関数を繋げて使うデザイン
tidyverse
Rでデータを上手に扱うためのパッケージ群
install.packages("tidyverse")
library(tidyverse)
# 関連パッケージが一挙に読み込まれる
Conflicts ❌とか表示されて不安だけど
これは大丈夫なやつ:
── Attaching packages ─────────────────────────────────────── tidyverse 1.3.0 ──
✔ ggplot2 3.3.0     ✔ purrr   0.3.4
✔ tibble  3.0.1     ✔ dplyr   0.8.5
✔ tidyr   1.1.0     ✔ stringr 1.4.0
✔ readr   1.3.1     ✔ forcats 0.5.0
── Conflicts ────────────────────────────────────────── tidyverse_conflicts() ──
✖ dplyr::filter() masks stats::filter()
✖ dplyr::lag()    masks stats::lag()
Many other useful packages

- readxl: エクセル形式の読み込み
- stringr: 文字列の処理
- Bioconductor: バイオインフォマティクス関連
- igraph: グラフ(ネットワーク)関連
- rgl: 3Dの作図
- R Markdown:
Rコマンドと結果を埋め込んだPDFやHTMLを作る。
この発表スライドもそうやって作った。
レポート作成や共同研究者への報告にも便利!
How to solve problems
- RStudio内にヘルプを表示:
?sum,help.start() - 変数の構造を確かめる:
str(iris),attributes(iris) - エラー文をちゃんと読む:
No such file or directory - エラー文やパッケージ名をコピペしてウェブ検索
→ StackOverflow や個人サイトに解決策 - Slack
r-wakalang で質問を投稿する。
(質問に飢えた優しいワニが多数生息 👀 👀 👀 👀) - 状況再現できる小さな例
(reprex)
を添えると回答を得やすい。
(これを準備してるうちに問題が切り分けられて自己解決したり) - パッケージの公式ドキュメントをちゃんと読む
R basics: Summary
✅ Write R script, and send it to Console.
✅ Object types: numeric vector, data.frame, etc.
✅ Use packages.
✅ Relax. You know how to solve problems.
Reference
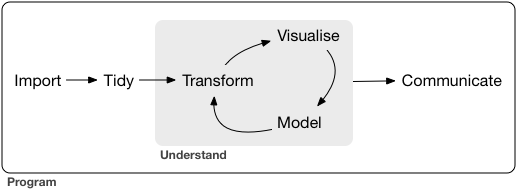
- R for Data Science — Hadley Wickham and Garrett Grolemund
- https://r4ds.had.co.nz/
- Book
- 日本語版書籍(Rではじめるデータサイエンス)
- Older versions
- 「Rにやらせて楽しよう — データの可視化と下ごしらえ」 岩嵜航 2018
- 「Rを用いたデータ解析の基礎と応用」石川由希 2019 名古屋大学
- 「Rによるデータ前処理実習」 岩嵜航 2019 東京医科歯科大