library(tumopp)

.const = list(D = 3, C = "hex", k = 10, N = 2 ** 17, benchmark = TRUE)
.alt = list(
  L = c("const", "linear"),
  P = c("random", "mindrag"),
  d = c(0, 0.2),
  m = c(0, 2)
)
args_tbl = tumopp::make_args(alt = .alt, const = .const) |> print()
## # A tibble: 16 × 9
##    L      P           d     m     D C         k      N benchmark
##    <chr>  <chr>   <dbl> <dbl> <dbl> <chr> <dbl>  <dbl> <lgl>
##  1 const  mindrag   0       0     3 hex      10 131072 TRUE
##  2 const  mindrag   0       2     3 hex      10 131072 TRUE
##  3 const  mindrag   0.2     0     3 hex      10 131072 TRUE
##  4 const  mindrag   0.2     2     3 hex      10 131072 TRUE
##  5 const  random    0       0     3 hex      10 131072 TRUE
##  6 const  random    0       2     3 hex      10 131072 TRUE
##  7 const  random    0.2     0     3 hex      10 131072 TRUE
##  8 const  random    0.2     2     3 hex      10 131072 TRUE
##  9 linear mindrag   0       0     3 hex      10 131072 TRUE
## 10 linear mindrag   0       2     3 hex      10 131072 TRUE
## 11 linear mindrag   0.2     0     3 hex      10 131072 TRUE
## 12 linear mindrag   0.2     2     3 hex      10 131072 TRUE
## 13 linear random    0       0     3 hex      10 131072 TRUE
## 14 linear random    0       2     3 hex      10 131072 TRUE
## 15 linear random    0.2     0     3 hex      10 131072 TRUE
## 16 linear random    0.2     2     3 hex      10 131072 TRUE
set.seed(24601L)
results = tumopp::tumopp(args_tbl, graph = FALSE) |> print()

unnested = results |>
  dplyr::select(!c(population, seed)) |>
  dplyr::mutate(outdir = fs::path_file(outdir)) |>
  dplyr::select(where(\(x) dplyr::n_distinct(x) > 1L)) |>
  tidyr::unnest(benchmark) |>
  print()

df_benchmark = unnested |>
  dplyr::distinct(outdir, size, .keep_all = TRUE) |>
  dplyr::mutate(
    local = factor(local, levels = .alt[["L"]]),
    path = factor(path, levels = .alt[["P"]]),
    size = size / 1000,      # to K
    memory = maxrss / 1024,  # K to M
    utime = utime / 1000,    # ms to sec
    stime = stime / 1000,    # ms to sec
    maxrss = NULL
  ) |>
  print()

# usethis::use_data(df_benchmark, internal = TRUE, overwrite = TRUE)
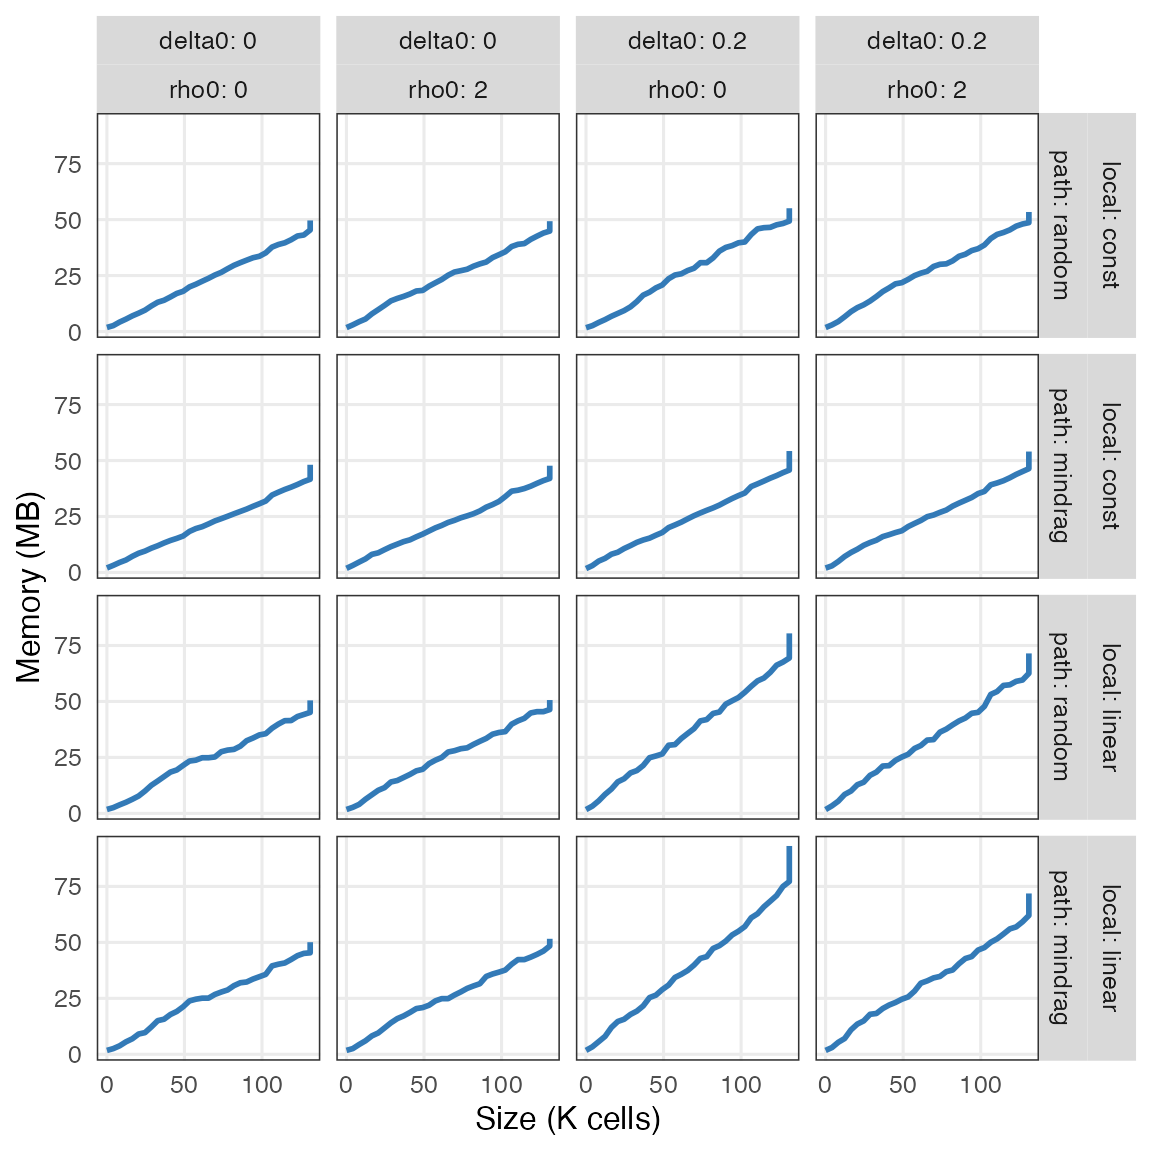
Memory
- Memory usage increases linearly with the increasing number of cells
because tumopp is an individual-based model of tumor
cells.
- Memory is also used to trace back cell lineages and write them to a
text file after growth simulation.
- Cell death makes cell lineages longer given the same number of
extant cells.
- The effect of cell death is more pronounced when the population
average of birth rate is decreased with local competition
(
-Llinear).
ggplot(df_benchmark) +
  aes(size, memory) +
  geom_line(linewidth = 1, color = "#337ab7") +
  facet_grid(vars(local, path), vars(delta0, rho0), label = label_both) +
  labs(x = "Size (K cells)", y = "Memory (MB)")
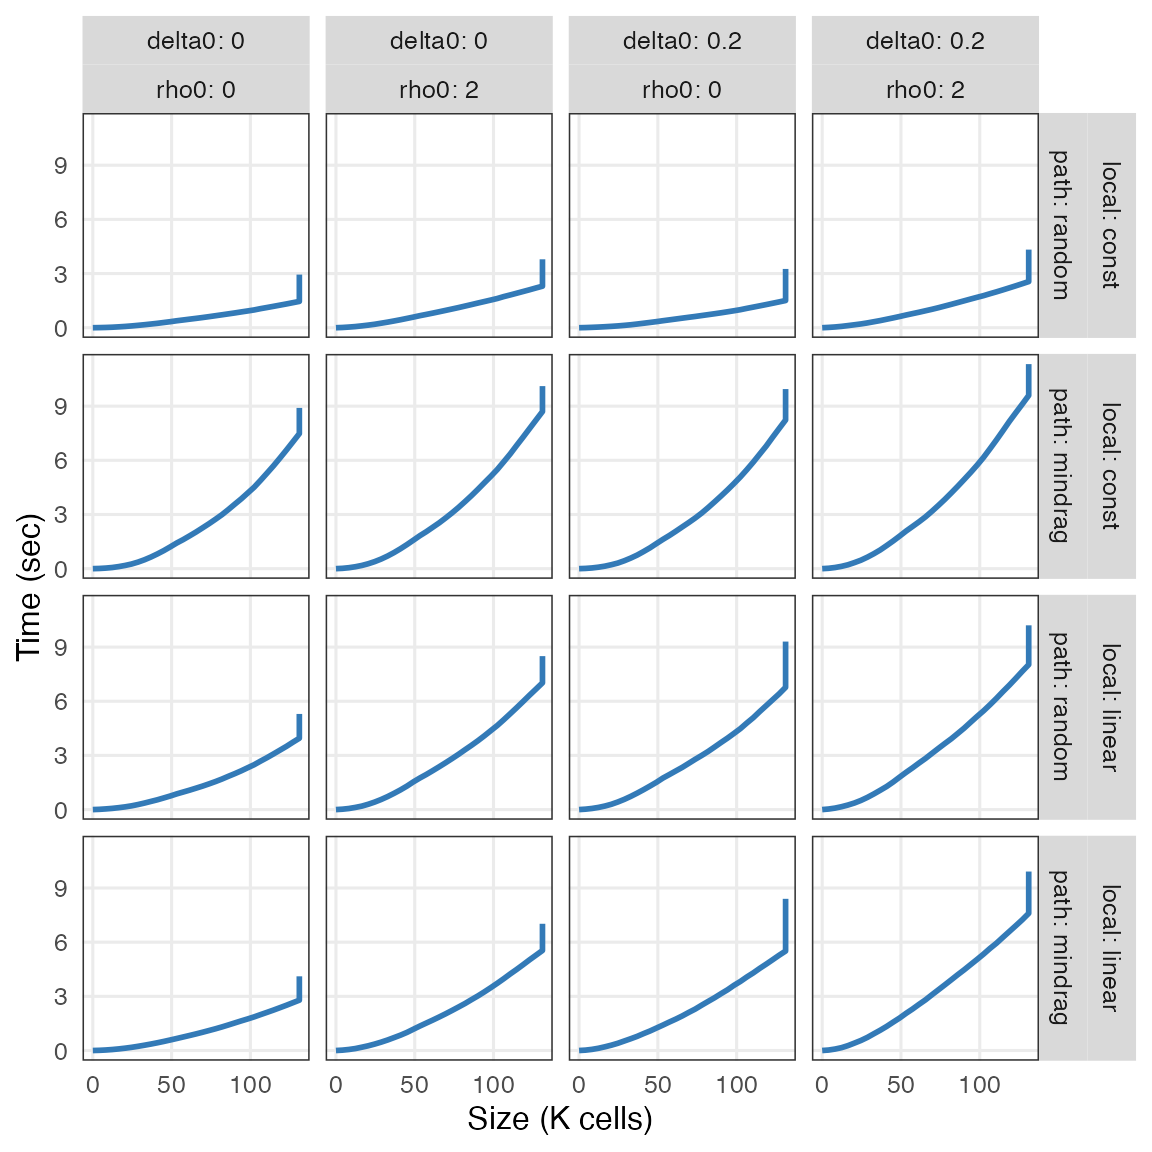
Time
- The larger a population gets, the longer it takes
- (
-Pmindrag) to search for nearest empty sites from
dividing cells,
- (
-Lconst) to push out other cells,
- (
-Llinear) to skip event queues of dormant (surrounded)
cells.
- The combination of
-Lconst -Pmindrag is slower than the
others because it involves both search and push from interior
cells.
- The effects of cell death and migration are smaller than those of
local competition (
-L) and placement of daughter
cells(-P).
ggplot(df_benchmark) +
  aes(size, utime + stime) +
  geom_line(linewidth = 1, color = "#337ab7") +
  facet_grid(vars(local, path), vars(delta0, rho0), label = label_both) +
  labs(x = "Size (K cells)", y = "Time (sec)")