Vertex attributes "x" and "y" are used as the cartesian coordinates for plotting.
They can be set by layout functions beforehand, or within augment().
plot() internally calls augment().
Arguments
- x
An igraph_ptr object.
- layout
A layout function or a
Vattr(x)-like data.frame with "x" and "y". If not provided,layout_nicely()is applied, which does nothing if "x" and "y" are already set in vertex attributes.- ...
Extra arguments passed to the layout function.
- lwd
Passed to
ggplot2::geom_segment().- cex, col, pch
Passed to
ggplot2::geom_point()andggplot2::geom_text().
Value
augment() returns a data frame to be used with ggplot2::ggplot().
plot.igraph_ptr() returns a ggplot object.
See also
layout_random() and others for layout functions.
Examples
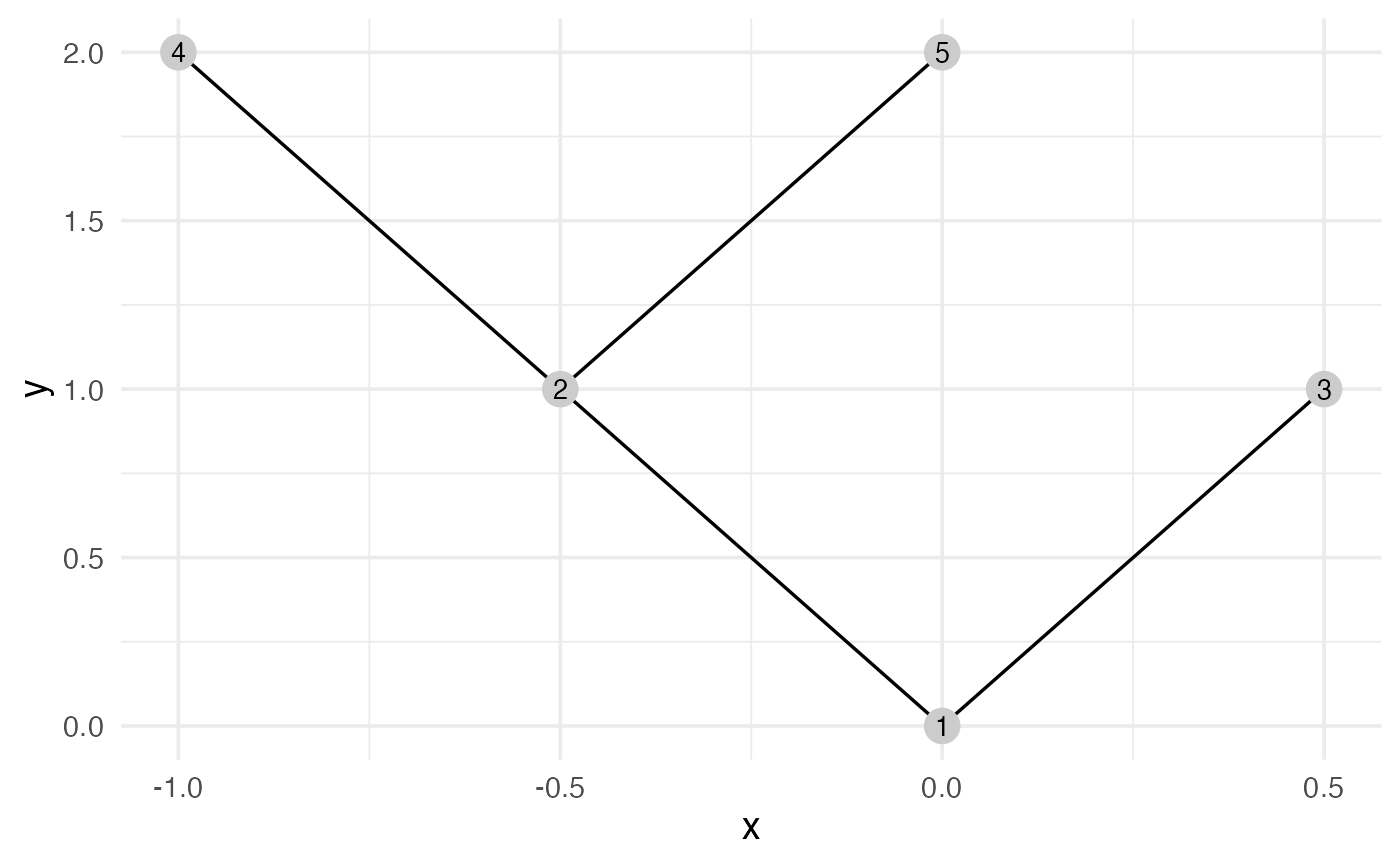
g = graph_tree(5L) |> layout_reingold_tilford()

augment(g)
#> # A tibble: 5 × 6
#>    from    to     x     y  xend  yend
#>   <int> <int> <dbl> <dbl> <dbl> <dbl>
#> 1     1     1   0       0   0       0
#> 2     1     2  -0.5     1   0       0
#> 3     1     3   0.5     1   0       0
#> 4     2     4  -1       2  -0.5     1
#> 5     2     5   0       2  -0.5     1

plot(g) + ggplot2::theme_minimal(base_size = 14)